Occupancy Report

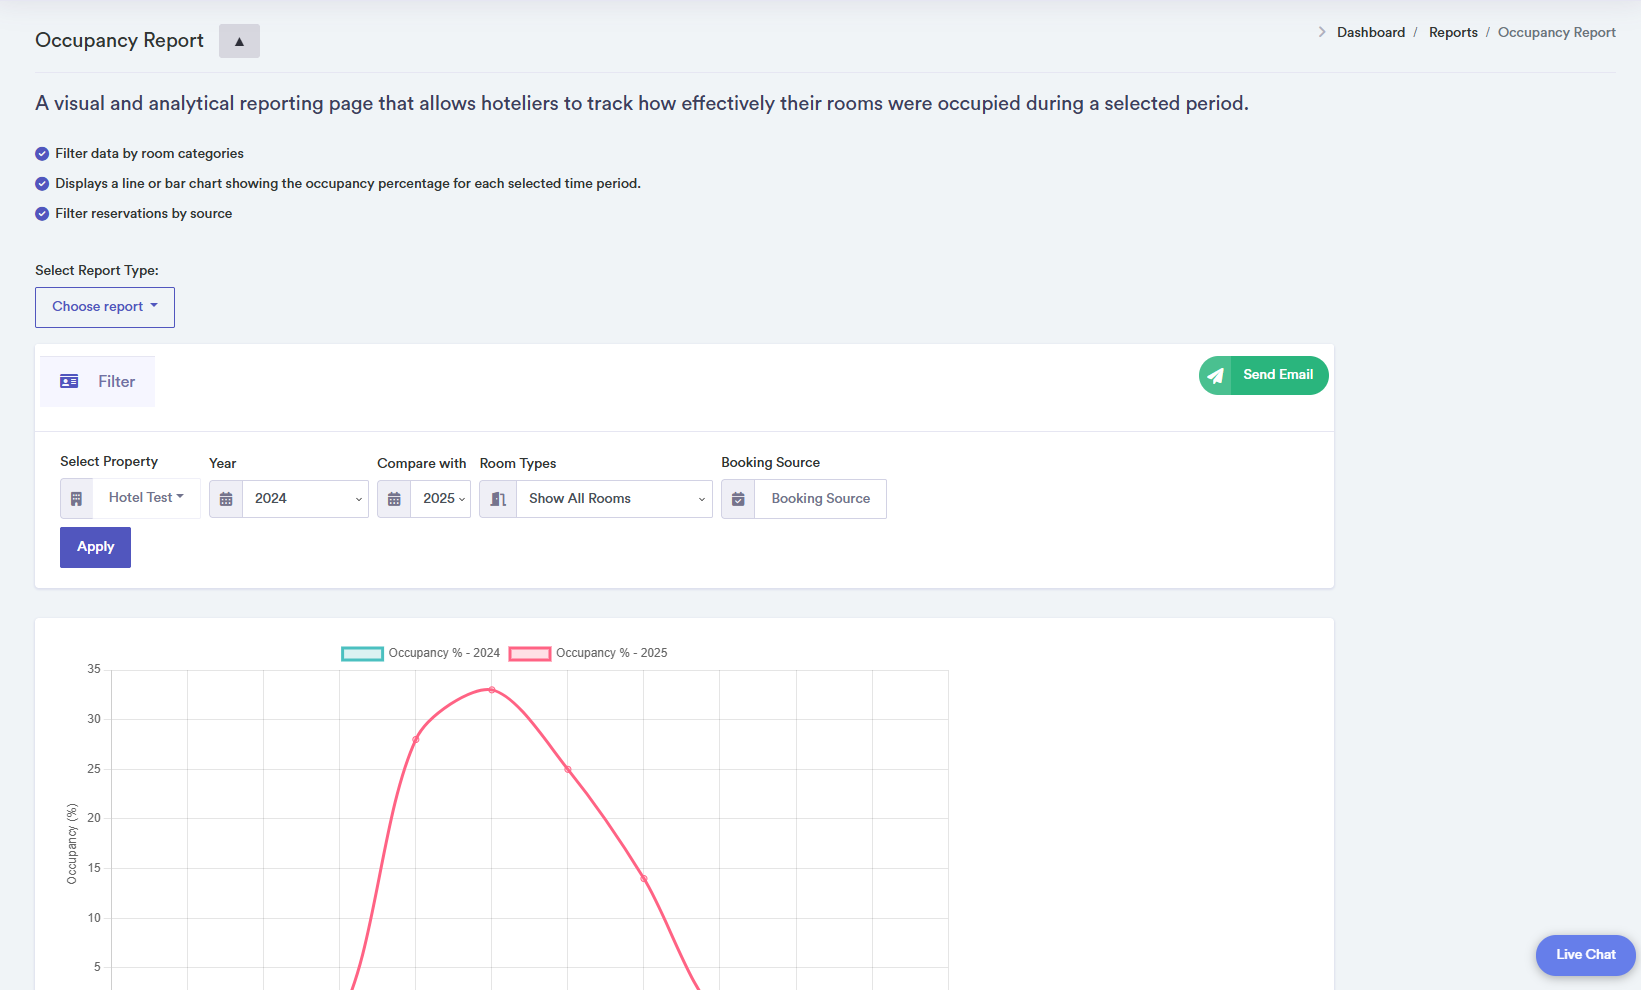
The Occupancy Report allows hoteliers to visualise and analyse how effectively their rooms were occupied during a selected period. Managers can monitor occupancy trends month-by-month and compare multiple years side by side.
How to Use the Occupancy Report
- Select the property to analyse from the dropdown menu. You can search through hotels, and the system remembers previously selected properties.
- Select a primary year for analysis and optionally a second year for comparison. One year shows a single chart and table; two years display separate charts and tables for side-by-side comparison.
- Apply filters such as Room Categories and Booking Sources (Booking.com, Airbnb, HotelBeds, Expedia, direct website, etc.). Multiple sources can be selected at the same time.
- Click the "Apply" button to fetch occupancy data. The system retrieves monthly occupancy percentages.
- The report displays a line or bar chart showing occupancy percentage trends per month. Tables provide precise monthly occupancy percentages, total price ( ), and number of occupied rooms. Two years produce two tables below the charts.
- Use the "Send Email" button to export the report in PDF format.
- Confirmation pop-ups appear when data is successfully loaded. Error pop-ups notify the user if data cannot be retrieved.
Click on a month in the chart or table for detailed occupancy information.